


Hott Lott (candles + btn) Indicator
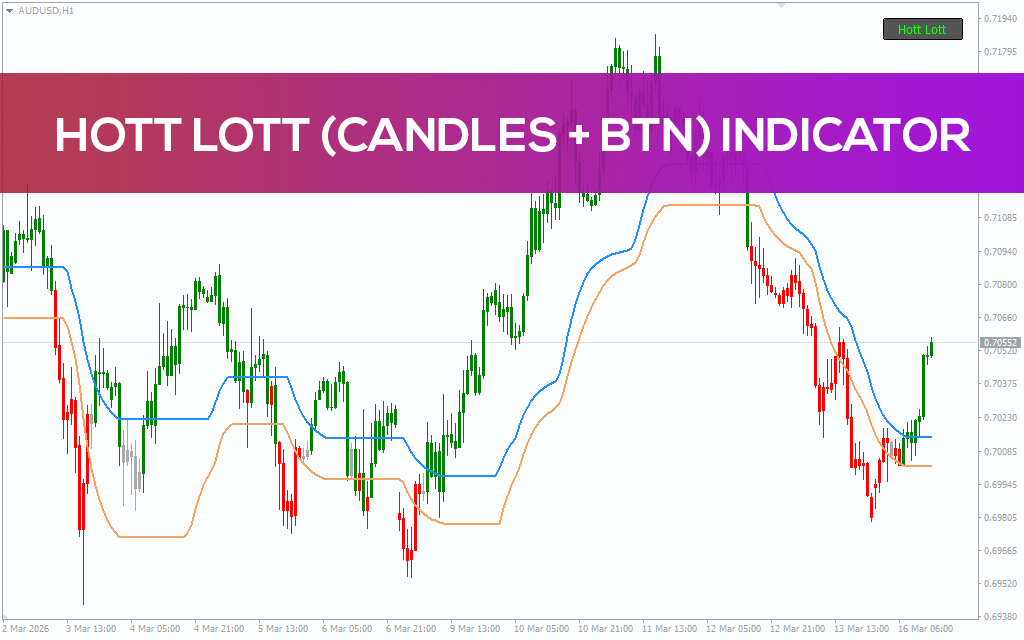
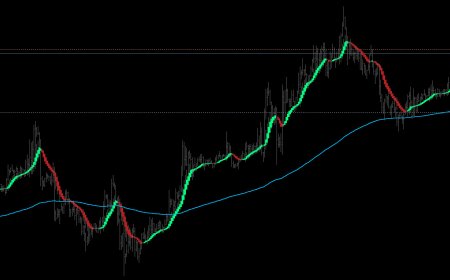
The Hott Lott (candles + btn) Indicator is a trend following tool based on the Optimized Trend Tracker (OTT) concept. It incorporates dynamic channel levels, moving average calculations, and color-based candle visualizations that help traders instantly get a feel for the current market direction.
While many trend indicators depend only on lines or oscillators, the Hott Lott gives you visual clarity with color for candles to better match trend conditions. This allows to note much easier when the market shifts from bearish to bullish momentum or when a trend begins to weaken.


It also plots a channel with recent highs and recent lows along with an optimized moving average calculation. These levels function as dynamic support and resistance zones, allowing traders to determine whether the price is trending, consolidating, or preparing for a reversal.
The feature itself is convenient for traders to turn on or off the indicator from the chart. This is handy during a multi setup comparison for the analysis or while switching a trading view.
Hott Lott (candles + btn) Indicator Trading Signals
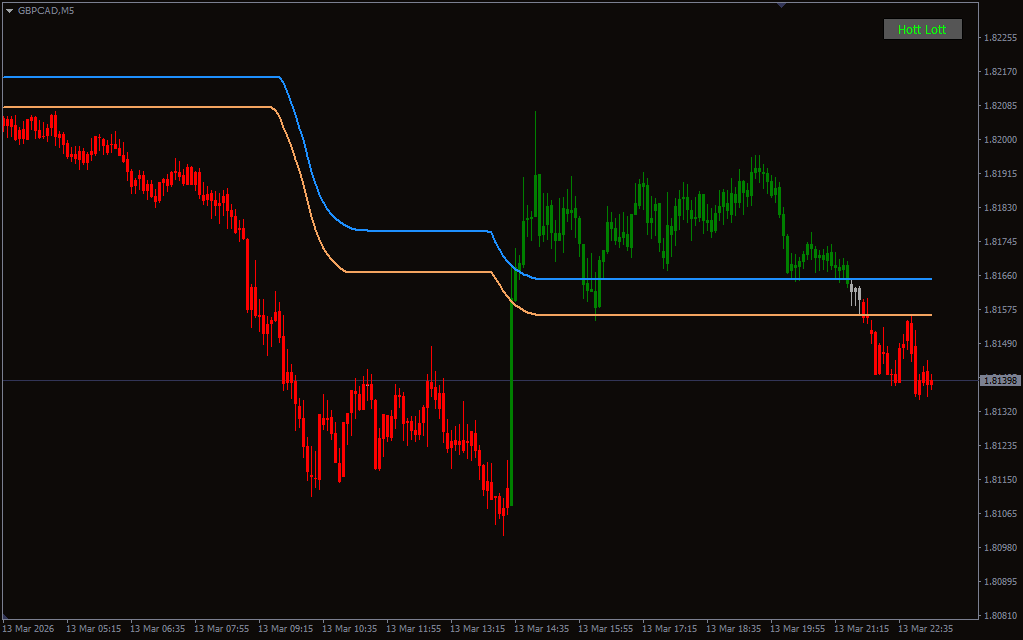
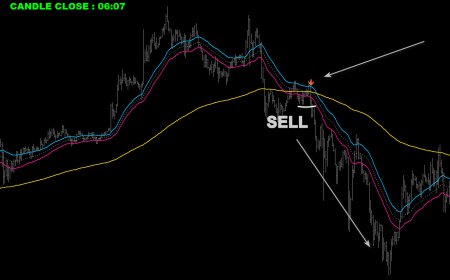
The indicator identifies trend direction by moving average analysis and an OTT optimization coefficient. If the price moves above the trend channel that we have computed, the candles will become bullish and the indicator will represent a positive trend environment. In addition, traders in this situation will often seek out opportunities to buy or set a continuation of the trend.
If price drops below the channel, the candles turn into a bearish shade which reflects downward movement. Such a move usually depicts that sellers have established more strength and the market will continue to slide lower.
Perhaps most useful about this indicator is their visualisation of market phases. During those positive trends, price usually remains either above the channel or below the channel for extended periods and the color of the candle can help validate that momentum remains stable.
When price crosses the channel and candle hues change, it is common to see a trend reversal. Such moments can signify where an entry or warning is likely that the current trend is losing favor.
The indicator works well in practice when combined with a support or resistance analysis, with higher time horizons in trend direction for each factor. In the case Hott Lott confirms the same direction as broader market structure, the signals are more certain.
Conclusion
The Hott Lott (candles + btn) Indicator combines OTT trend logic with dynamic channel levels and color-coded candles to yield a visually intuitive approach to trend analysis. This integration enables traders to rapidly ascertain whether the market is trending upward, downward, or transitioning between phases.
With this clear visualization and customizable settings, the indicator can be helpful for both beginner traders wanting simple trend guidance and experienced traders looking for an additional confirmation tool.
When used alongside price action analysis or higher timeframe structure, Hott Lott becomes a practical part of a structured trend-following strategy.
The post Hott Lott (candles + btn) Indicator appeared first on indicatorspot.com.