


Optimized Trend Tracker Indicator
OTT (Optimized Trend Tracker Indicator) is a trend-following tool for determining the main market direction and removing the short-term noise. While traditional moving averages respond slowly to changing market dynamics, OTT uses adaptive smoothing with a volatility-adjusted tracking mechanism to develop a dynamic trend line.
Hence, the indicator is based on the VIDYA (Variable Index Dynamic Average) algorithm which scales the model’s sensitivity with regard to the market conditions. This helps the trend line to react faster in highly directional movements and remain stable in consolidation phases. This balances trading theory with reality as it minimizes false calls while still enabling traders to be present on trending markets for more extended periods of time.


The OTT is basically a simple trailing stop line in action. When price is above the line, the market is seen as bullish. After falling below that line, the structure changes to bearish. The trend is made visually visible via color shifts that make it simple to ascertain the direction of the market at a glance. The indicator makes this clear by highlighting these color changes visually and therefore visualizes the price trends with a big color change easily.
Optimized Trend Tracker Indicator Trading Signals
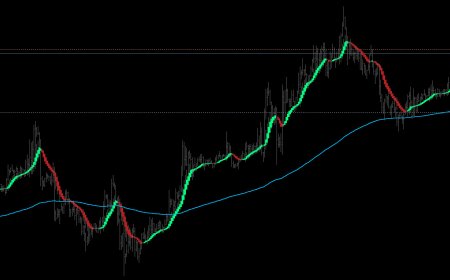
![]()
The fundamental concept behind OTT signals is trend continuation rather than predicting reversals. If the price goes above the OTT line and the line goes bullish (usually as shown in green color), then it means buyers have taken over the market and an upward market will prevail.
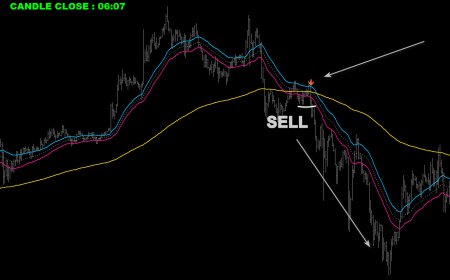
On the other side, if price drops below the OTT line and the line turns bearish color, then selling pressure has taken over. That switch sometimes happens following a structural shift in market momentum.
One of the strengths of the OTT indicator is its reactivity to volatility. When those trending are strong, the line gradually trails price and lets traders stay in the trend rather than dropping out too soon. Such behavior closely resembles the trailing stop used by institutional trend-following strategies.
The reality is that most traders consider OTT a trend filter — not a unique entry signal. For example, if the OTT line indicates a bullish higher timeframe trend, then traders might only seek out buy setups on lower timeframes. The way this approach helps improve trade consistency is such a simple filtering technique to position entries with the wider market.
It is also a significant note to recognize how the OTT performs under consolidation. Rather than being an ever-swinging average in that direction across the board like many rapidly moving averages, it is rather consistent until a meaningful momentum shift occurs. This quality minimizes the risk of whipsaw conditions that can damage trend strategies.
Conclusion
Optimized Trend Tracker Indicator is a highly-advanced trend-following instrument with adaptive smoothing as well as dynamic trend tracking. This uses the VIDYA algorithm for the time-varying volatility of the markets without adding noise, which is prevalent in conventional moving averages.
In terms of trading, OTT is very good for directional filters. Rather than trying to predict each market turn, it focuses on positioning to keep your position within trends that have been generated, it avoids predictions. When combined with price structure analysis or higher-timeframe bias, it can be a significant weapon in a systematic trading strategy.
The post Optimized Trend Tracker Indicator appeared first on indicatorspot.com.