


TDI Alerts v3.0 Indicator
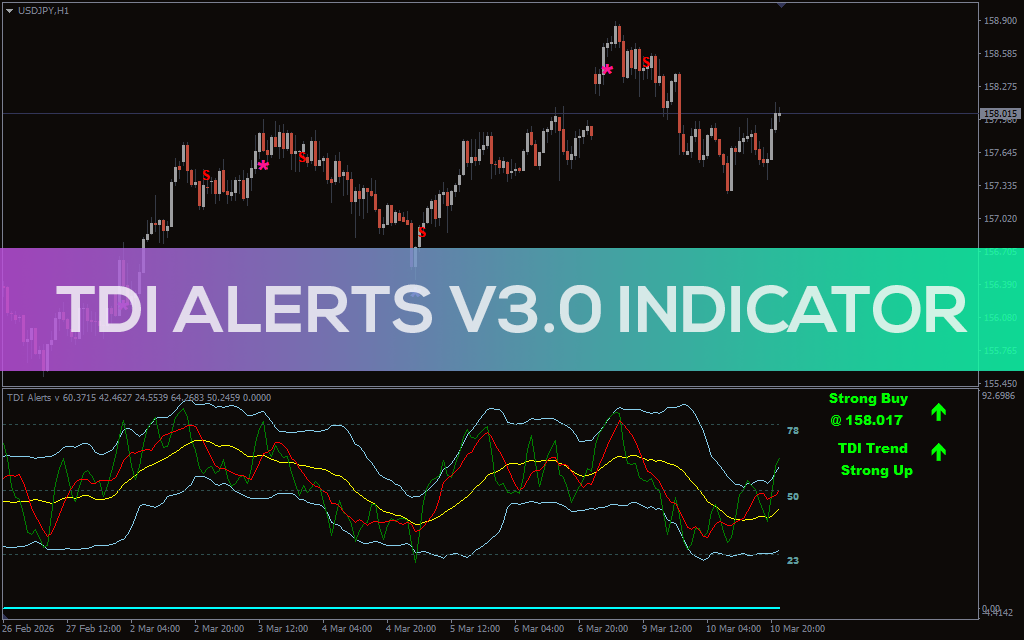
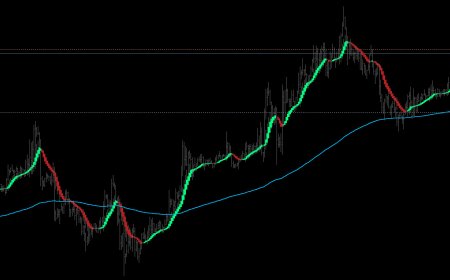
The TDI Alerts v3.0 indicator is an effective improvement on the widely accepted framework of the Traders Dynamic Index (TDI). It integrates RSI momentum analysis, volatility bands, and moving average signal lines in one harmonious oscillator to help traders observe trend direction, momentum shifts, and potential entry spots.
This approach was originally popularized in discretionary trading systems like the “Trading Made Simple” strategy, which enables traders to visualize market momentum and trend strength graphically. The TDI Alerts v3.0 enhanced the old concept with automated alerts, clearer signal visualization features, and adjustable filters.


Unlike the traditional mechanism that requires traders to keep an eye on oscillator crossovers themselves, this indicator shows potential trades at a glance, right on the graph. When certain conditions are met, arrows will appear on the price chart, and the oscillator panel will display the relationship between momentum and volatility.
TDI Alerts v3.0 Indicator Trading Signals
The indicator creates signals mainly through action of the RSI price line with respective trade signal lines found inside the oscillator window. Since when the RSI momentum changes direction, it crosses the signal line, the indicator interprets this as a possible shift in market momentum.
As momentum is gaining strength, a bullish signal occurs when the RSI line crosses above the signal line. When this occurs in supportive conditions, the indicator outputs a buy arrow on the chart, and may generate a Strong Buy alert depending on the configuration.
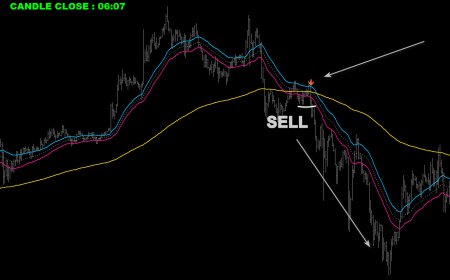
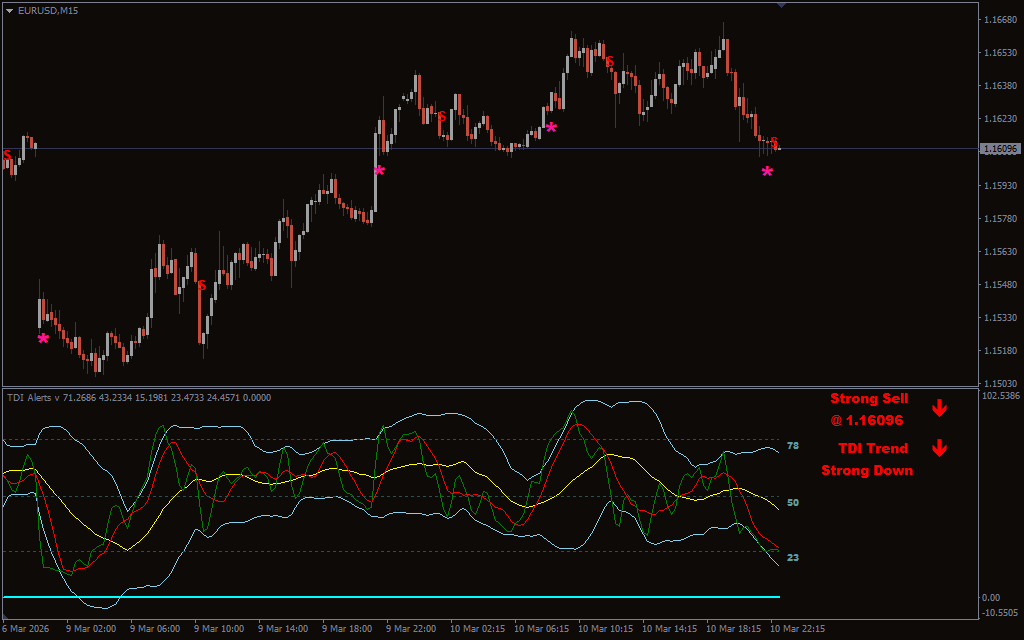
Bearish signals are generated when the RSI line crosses below the signal line and the oscillator moves downward. When moving away from the consolidation zone, the indicator will start to produce a sell arrow and a Strong Sell alert.
Another important component of the indicator is the volatility band. They act like the Bollinger Bands, except that they are applied to the structure of the RSI and not to price. With momentum reaching the upper band, the market may be approaching an overbought condition. On the other hand, if it touches the lower band, the market may be oversold.
The indicator is also based on predefined levels such as Overbought Level (78) and Oversold Level (23). Signals at or near these extremes typically show stronger reversals or momentum exhaustion.
TDI signals in conjunction with higher timeframe trend analysis are preferred by many traders for practical trading. When the oscillator confirms momentum in the direction of the prevailing trend, such signals tend to be stronger.
Conclusion
TDI Alerts v3.0 Indicator is a comprehensive momentum and trend analysis tool, based on the classic Traders Dynamic Index framework. Combining RSI momentum with volatility bands, signal line crossovers, and automated alerts, it offers a clear and structured view of market conditions.
Its biggest advantage is the ability to highlight potential trade opportunities without requiring traders to constantly monitor the oscillator. The addition of alerts, trend visualization, and customizable filtering makes it significantly more practical than the original TDI implementation.
When paired with market structure analysis, support and resistance levels, or higher timeframe trend direction, the TDI Alerts v3.0 Indicator can serve as a valuable component of a disciplined trading strategy.
The post TDI Alerts v3.0 Indicator appeared first on indicatorspot.com.